Occasionally our JVM (Java, Scala, or Kotlin) apps experience problems where they either completely run out of memory and are forced to shut down, or they start to do repeated Full GC which reduces throughput. Thankfully the JVM has good tools for looking at what it is doing at a point in time, and strangely I quite enjoy post mortem detective work.
I’ve done a good number of these in the past and every case is slightly different, but there are a few common techniques that you can build up over time so it’s best if I narrate through this as though you are debugging along with me.
In this case we have a situation where a single web application server would run out of memory, with no regular pattern. This often points to the trigger being a particular request that is very memory intensive. Fortunately we have a cluster of application servers so things keep ticking along while this one restarts.
Getting the heap dump
We pass this flag to our Tomcat servers so that the JVM automatically generates a heap dump before it shuts down due to OOM (Out Of Memory):
-XX:+HeapDumpOnOutOfMemoryError
If a process is still running, but very busy with Full GC, then we would trigger our own heap dump with jmap (or jcmd in newer JDKs).
I copy that file locally for analysis.
Analysing
I use Eclipse Memory Analyzer to open heap dumps. Here’s what it says when we open this one.
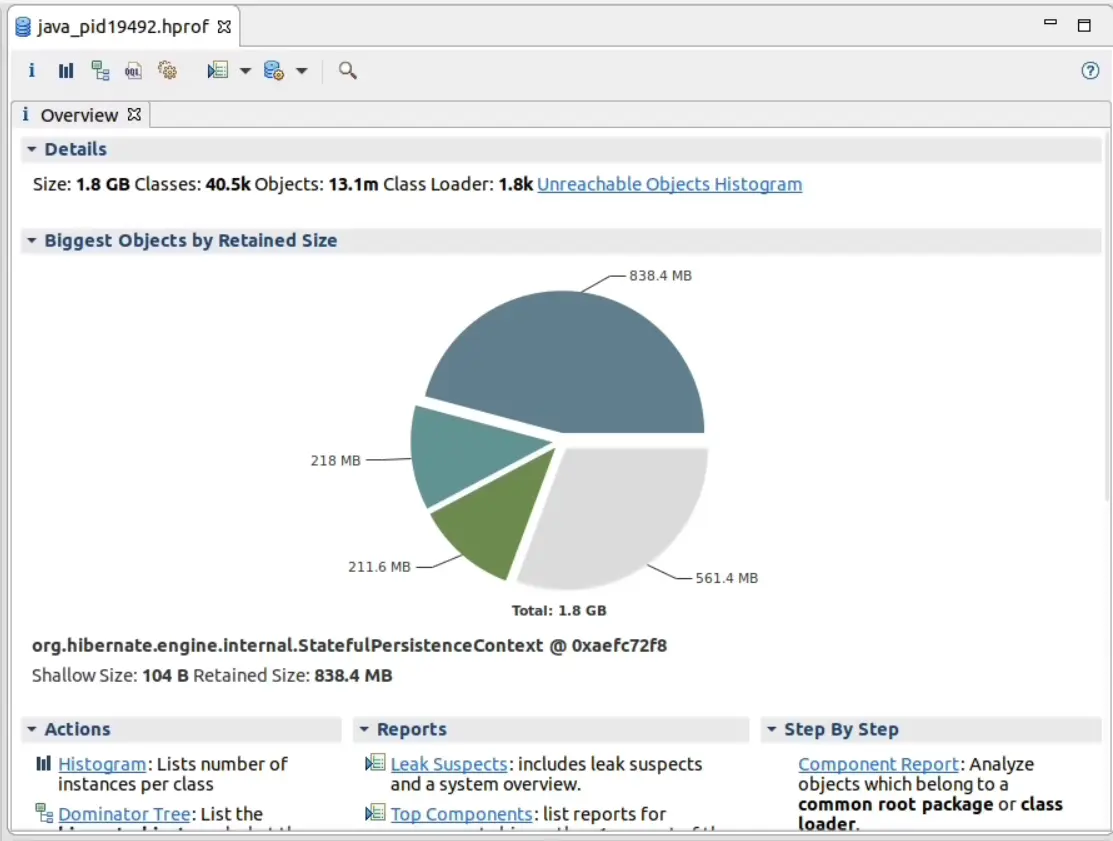
What a pile of garbage. Often this initial screen doesn’t tell you a lot. We already suspect a particular expensive request, and in a Servlet container these are generally thread-level so let’s look at the threads. When I first started using MAT this feature didn’t exist (it wasn’t until Java 6 that the information was included in the dump, and later still that MAT implemented the feature) but we can now view each thread’s stack and from there, any references to/from that Thread. It’s indispensable for a busy server where a lot of unconnected work might be going on.

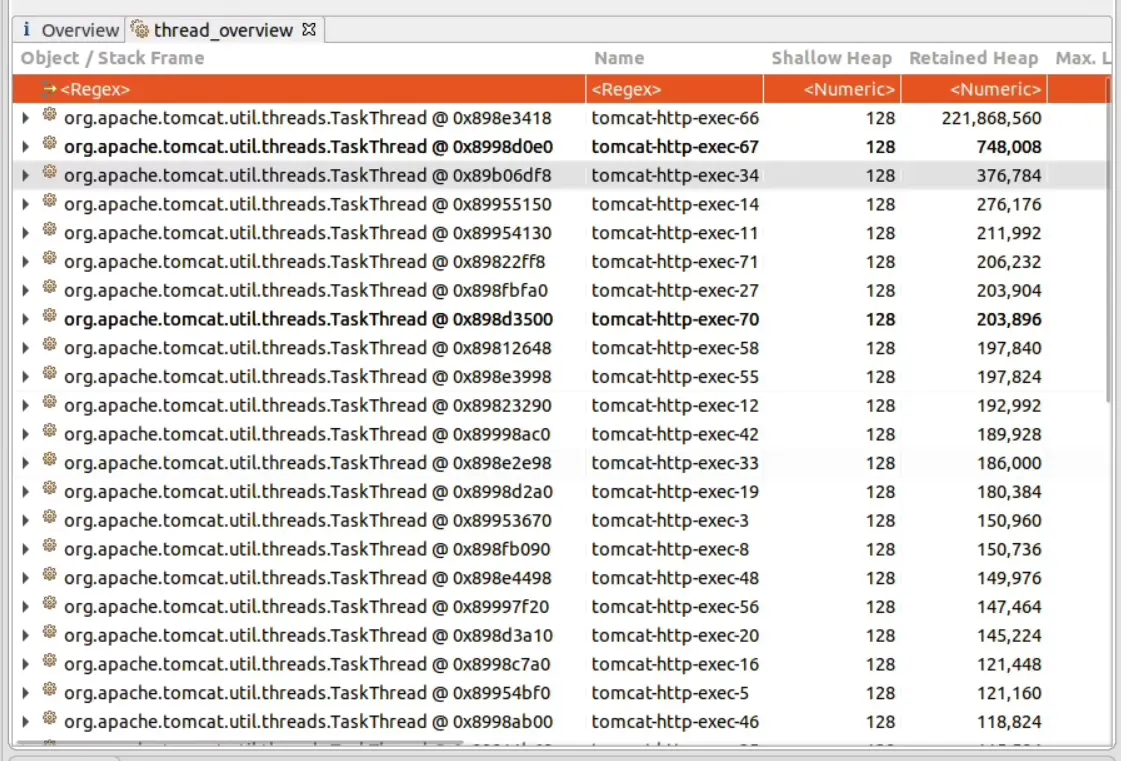
A lot of threads, mostly the same, but look at that Retained Heap on the top one. It’s holding onto a lot of something. Let’s see what it was up to!
Opening it up, the stack trace is a lot of Postgres and Hibernate stuff, which makes sense as the database is where all the data is, and data lives in memory.
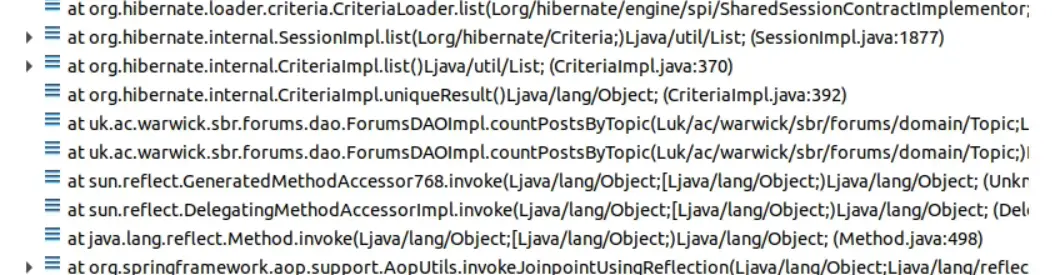
This is the part of the stack where our code is happening. It’s getting a count of posts for a particular forum topic. As a single number can’t be taking up a lot of memory in the application, we have to conclude that it isn’t the current action consuming the memory.
The request will have done other work that may have pulled objects into its grasp, and a Hibernate app is very good at doing this thanks to the Session which keeps references to every object loaded, unless evicted or cleared. Let’s look at outgoing references of the thread to see what is holding on to data. (We can also try the Dominator view which can give better results.)
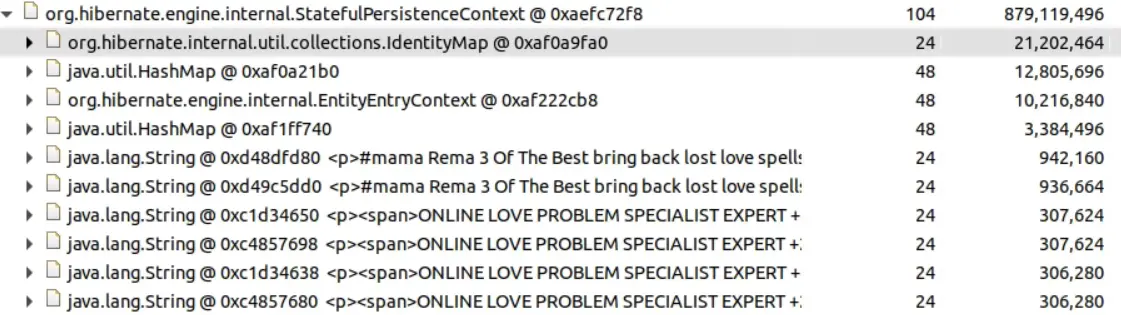
Ah. We have a lot of String objects here that do not look welcome. The Hibernate persistence context manages the data cached for a Hibernate session, holding on to entities to be re-used when they are referenced elsewhere. As this is a request for a forum it seems likely that the String data related to a large amount of spam. We need to find out where it is, and why we end up loading a lot of it.
Looking at the database I quite quickly find large numbers of forum posts containing this content. In this case the permissions for some forums have been set up too loosely, allowing miscreants to post spam. We can clean the data, tighten up permissions and enforce spam detection, but it still doesn’t answer why this would cause the application to use so much memory.
Going back to our stack trace and looking further up (down?) the stack, we confirm that it is inside the controller responsible for rendering a view of a forum.
This leads me to take a closer look at our pagination widget:

This doesn’t seem like a very good idea. As much as a user might wish to see all the topics at once, allowing this on an unbounded and potentially very large collection (people don’t tend to clean up their forums) does not seem wise. Removing this option should avoid the possibility to load a large amount of data into memory at once.
Generally we should be wary of any kind of findAll method for any collection that is unbounded and returns an in-memory List of results. If we really need to work through all entities for some reason (aggregating results, or streaming data direct to storage) then there are ways to stream (or “scroll” in JPA/Hibernate land) through the results without keeping them all in memory. That way memory usage becomes constant rather than linear.
Side note: while investigating this I noticed some forum post content entries that were very large, which turned out to be where browsers have allowed the user to paste in an image and encoded it as a data: URI in the content. This also won’t help with memory and is a waste of space in the database so we’ll make a change to force these to become separate attachments.
If you have used Hibernate extensively then it may not surprise you to learn that almost all of these heap analyses turn out to be Hibernate related. This is slightly unfair as of course it’s our data causing the problem, but it does seem to disproportionately affect applications that use an ORM library. As others have written, an ORM is a leaky abstraction that wants you to treat an entity object as a normal object with normal getters, but it will always remind you what’s behind those getters at the most inconvenient times.
Summary
- Look for the obvious dominators (one big object, or a lot of objects)
- Follow references to see what is keeping these objects alive
- Use knowledge of the application to connect the dots (vague I know, but it really is case-specific)